Rail Diagnostics
Background
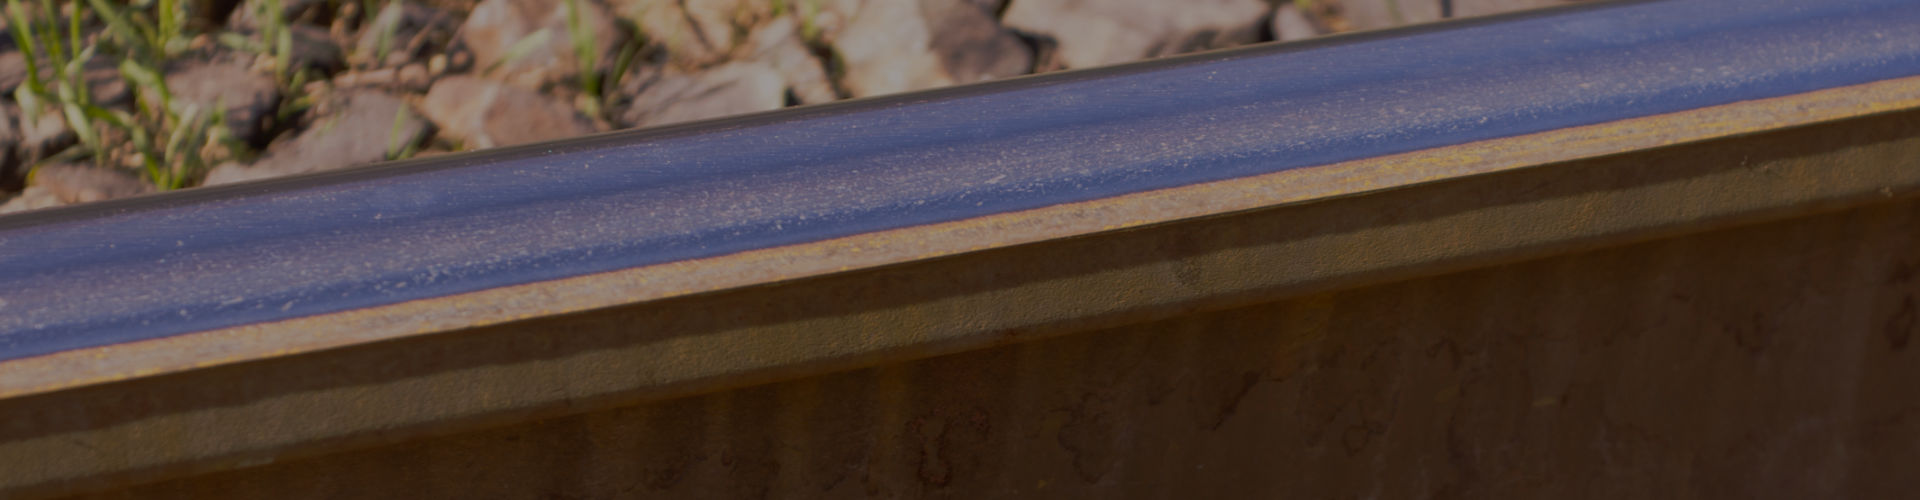
Rails wear over time and may sustain damage in the form of squats, wheelburns, shelling, corrugation, head-checks and eventually rail breakage. Several factors may be responsible including poor rail-wheel interaction, excessive track load, poor track geometry, damage caused by flat wheels, internal manufacturing defects, missing or loose fastenings in joint areas, poor rail grinding and so on. Once the top hard surface starts to wear out, rail surface wear can quickly spread; if rails experience repeated abnormal loads on weak spots, internal breakages quickly gain momentum and lead to rail fracture. The rail may suffer damage from top, side or in web areas. Figure 1 below shows an example of how poor rail wheel interaction causes corrugation, figure 2 shows a variety of rail defects that can develop over time, Figure 3 shows specific examples of visible rail defects on the surface based on internal damage.
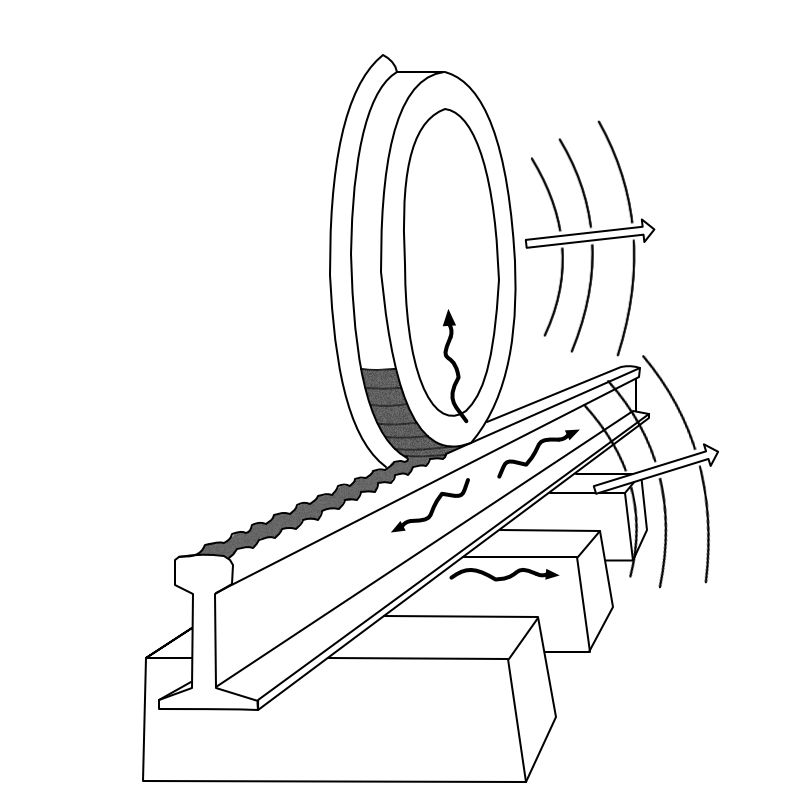
The regular passage of loads on a rail track can cause rail fatigue and damage the wheel. Internal stresses within the rail can create a range of defects both on the surface and internally which have the potential to break the rail and derail the moving vehicle. The track under load experiences a range of forces both longitudinally and laterally, as well as creates reaction forces on the wheel. Vertical forces are passed through the rail, sleepers and ballast into the ground. Abnormal rail wheel interaction puts excessive load on track sections which experience rail and wheel wear and breakages.
Traditionally, rail assessment has been based independent of load conditions, track geometry, recent changes to the rail (e.g. grinding) and traffic data, i.e. a reactive approach to finding defects as shown below and fixing it. Increasingly, sensors are being used to understand the root cause of rail damage for preventive maintenance and avoidance.
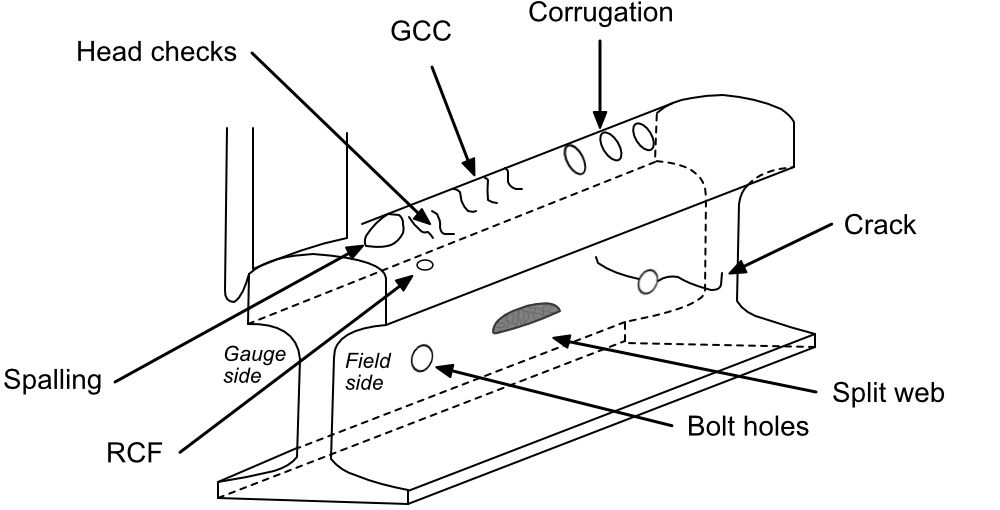
A range of defects can develop on the rail that require measurement and prioritisation for maintenance. On the railhead, gauge corner cracking, head checks and RCF cracks can develop which can over time split the rail. Abnormal movement of the wheel can cause rail corrugation, which can further lead to rail fractures. Squats, wheelburns, spalling and shelling defects can grow into large areas and damage the wheel. In certain circumstances, headchecks can start to split open into bigger defects and head of the rail may be crushed. On the side of the rail and web, cracks can develop to split the rail and any fishplate and other fastenings may break or fracture over time.
RV Diagnostics
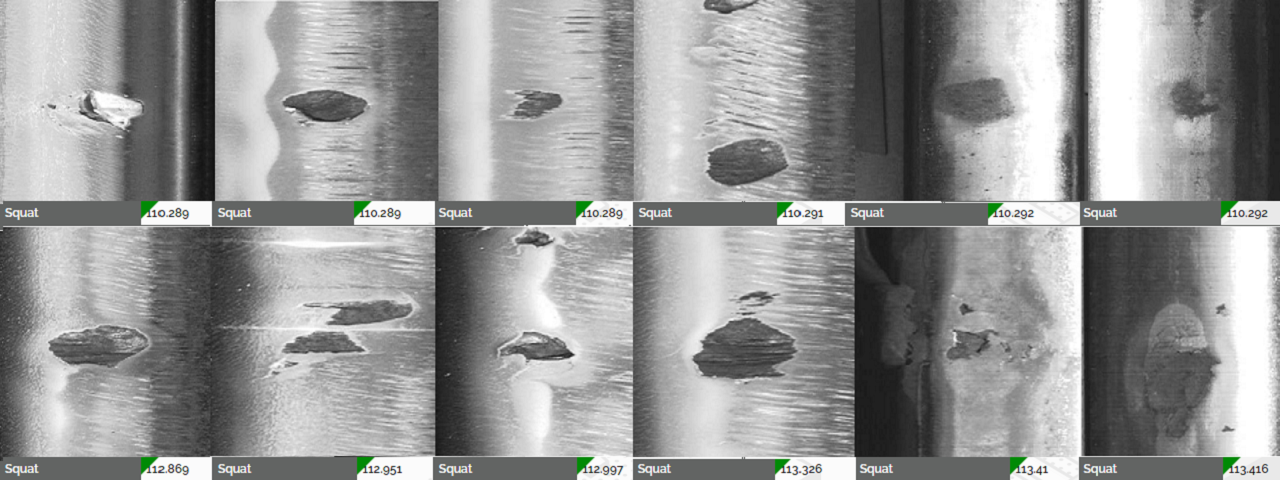
Rail Vision measurements are based on the use of linescan imaging at high resolution and then using machine vision and AI based analytics to automatically detect rail damage, classify it, and then measure it for dimensions. Each defect is indexed for track location. The following table shows the defects and measurements output by TrackVue Z series using a combination of linescan cameras and lasers.
| Rail Defects | |
|---|---|
| Rail cracks | Length, width, thickness, area, orientation, track position, severity |
| Rail breaks | Length, width, thickness, area, orientation, track position, severity |
| Squats and wheelburns | Length, width, area, orientation, track position, severity |
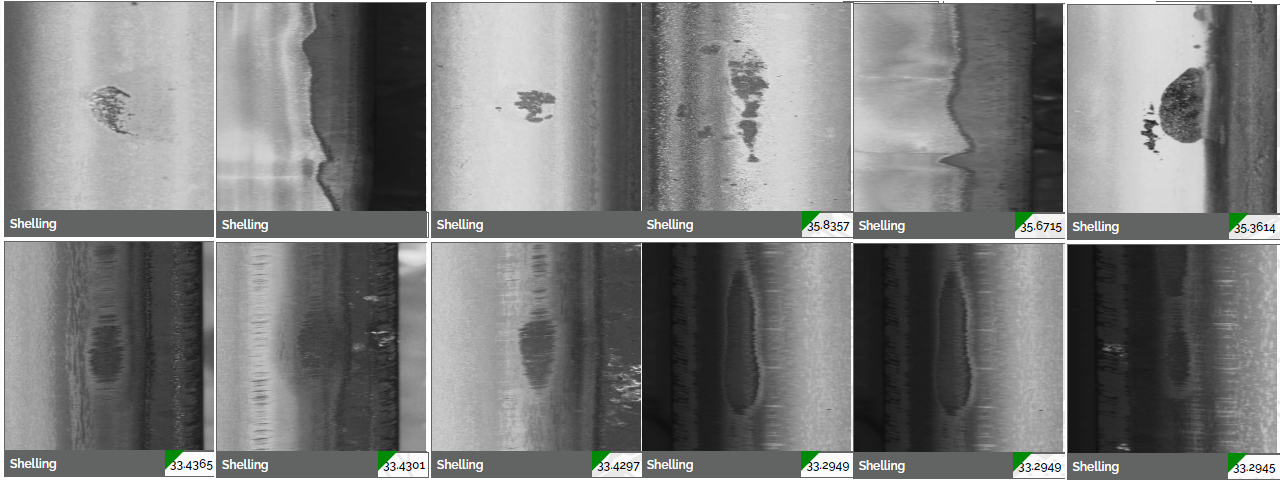
| Shelling | Length, width, area, track position, severity |
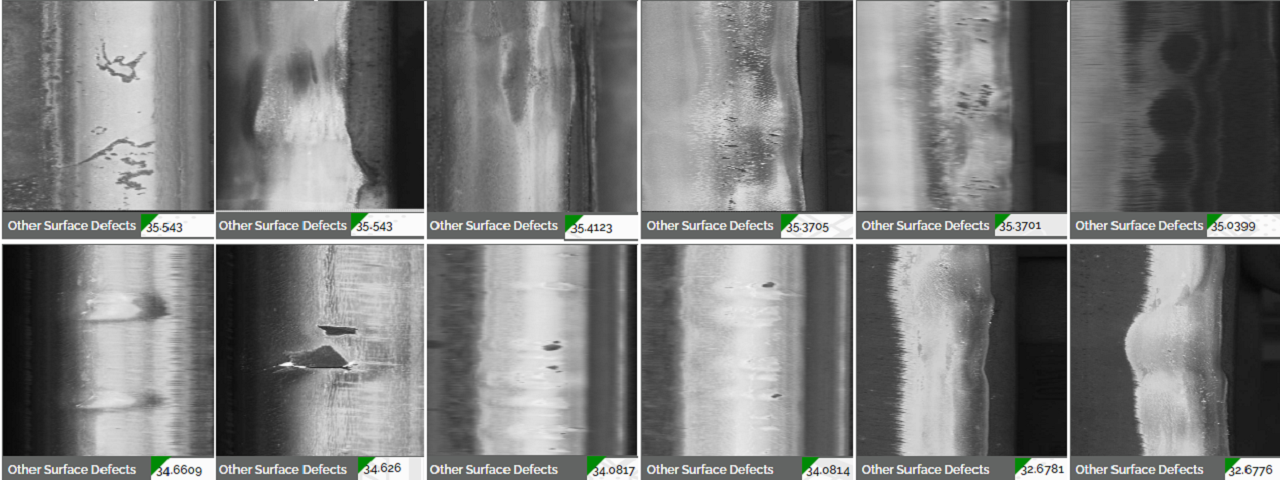
| Other surface defects | Length, width, area, track position, severity |
| Wear (Head and side) | Wear depth mm, volume, track position, severity |
| Curvature | Curvature radius |
| Grind marks | Density, start and end of clusters with track position, severity |
| Corrugation | Pitch, start and end position on track, severity |
| Rail Wear | |
|---|---|
| Rail | Type |
| Rail | Maximum side wear in mm, track position |
| Rail | Overall side wear in mm, track position |
| Rail | Maximum top wear in mm, track position |
| Rail | Overall top wear in mm, track position |
The following slide-show shows some of the rail defects detected by TrackVue Z system (as linescan imaged).
RV Advantage
The main advantage of using RV diagnostics on rails includes:
- Very high resolution image analytics at 0.25mm/pixel for vehicle speeds up to 80 kmph and 0.5mm/pixel for speeds up to 160 kmph.
- High quality output ideally suited for early detection of problems and predictive maintenance
- We combine a range of analytics from data including visual damage, rail wear, rail-wheel interaction, track geometry measurements, etc. to understand the root cause of the problem and highlight track sections under severe stress likely to get damaged the most over the future period; this focuses attention on network sections that need immediate action.