Data Management
Data management is the heart of the diagnostic system and probably as important as making accurate measurements. The volume of data collected by tracking and rolling stock inspection systems is huge. Once processed, the data reduces in size but is still significant and needs storage for future checks. Consequently, the overall data management process is far from trivial.
- All data collected on-board the train must have a process for removal and off-line storage. Raw data from the vehicle should be possible for manual removal if its large size makes it impossible to transfer over cellular network or wifi.
- All data processed on-board the vehicle with real-time analytics must be available for live display with measurements on-board the vehicle and easily transmitted to a cloud server in real-time. If resources are limited, only critical data may be transmitted and the remaining transmitted at a later time.
- An off-board facility for any offline data analytics needs to be available if needed
- All data must be quality controlled to remove errors before giving it to customers
- A complete cloud based data server must manage all forms of regular data input (coming from either real-time transfer from the train or an offline facility) and provide a user web server for them to access
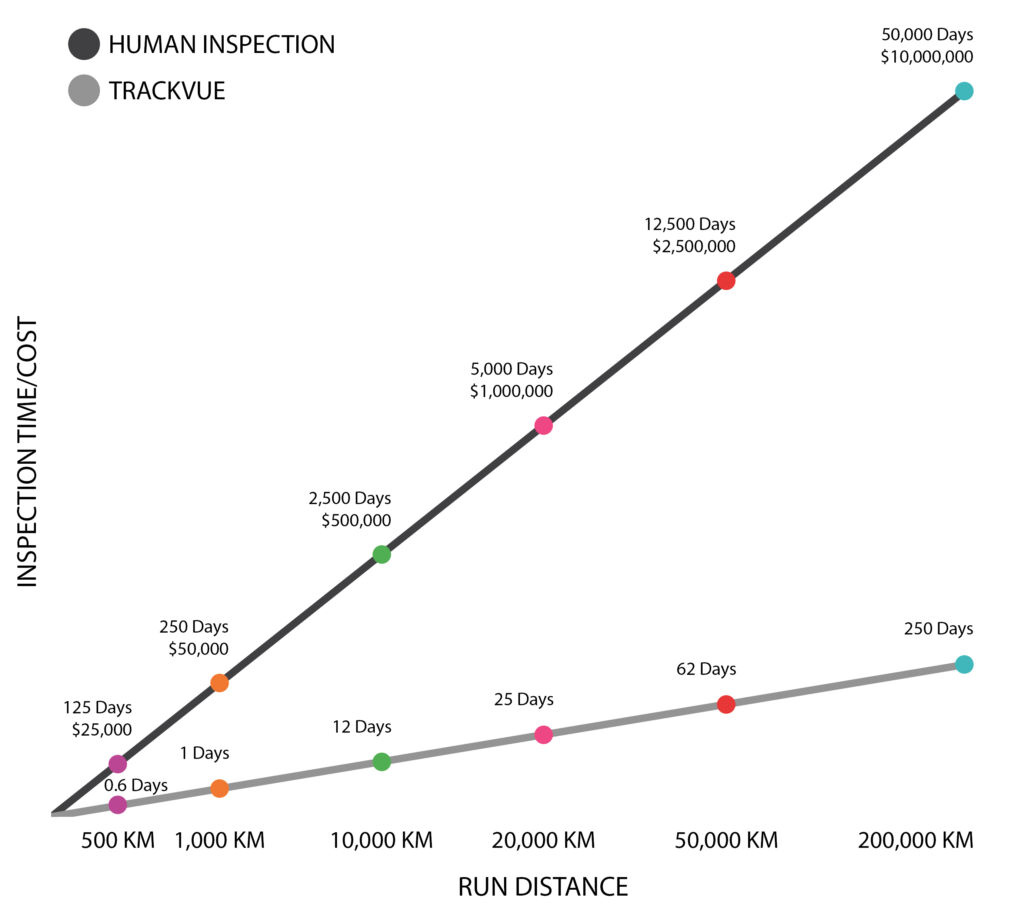
These varying requirements make the overall set-up challenging. The volume of data is the most important factor. If not careful, one can collect more data than what can be processed and actioned for maintenance. Let us take the example of track inspection by human walking and automated system such as TrackVue Z series. Without a doubt, automated systems can collect a lot of data and will cost less than track walking as shown below (graph shows man days of effort). However, their operational cost will increase linearly with data volume and unless detailed human and machine resources are available to manage and make use of so much data, the operation will fail. The moral of the story is to collect only what is needed. For example, on a Metro network a train can collect nearly 800km of data each day or more on the same line of say 100 km length, but it does not mean that we need to inspect each day. The selection of inspection frequency and approach (which track segments need more regular testing than others) is absolutely key to managing data volumes.
RV Data Management for Track Inspection
Track to Cloud
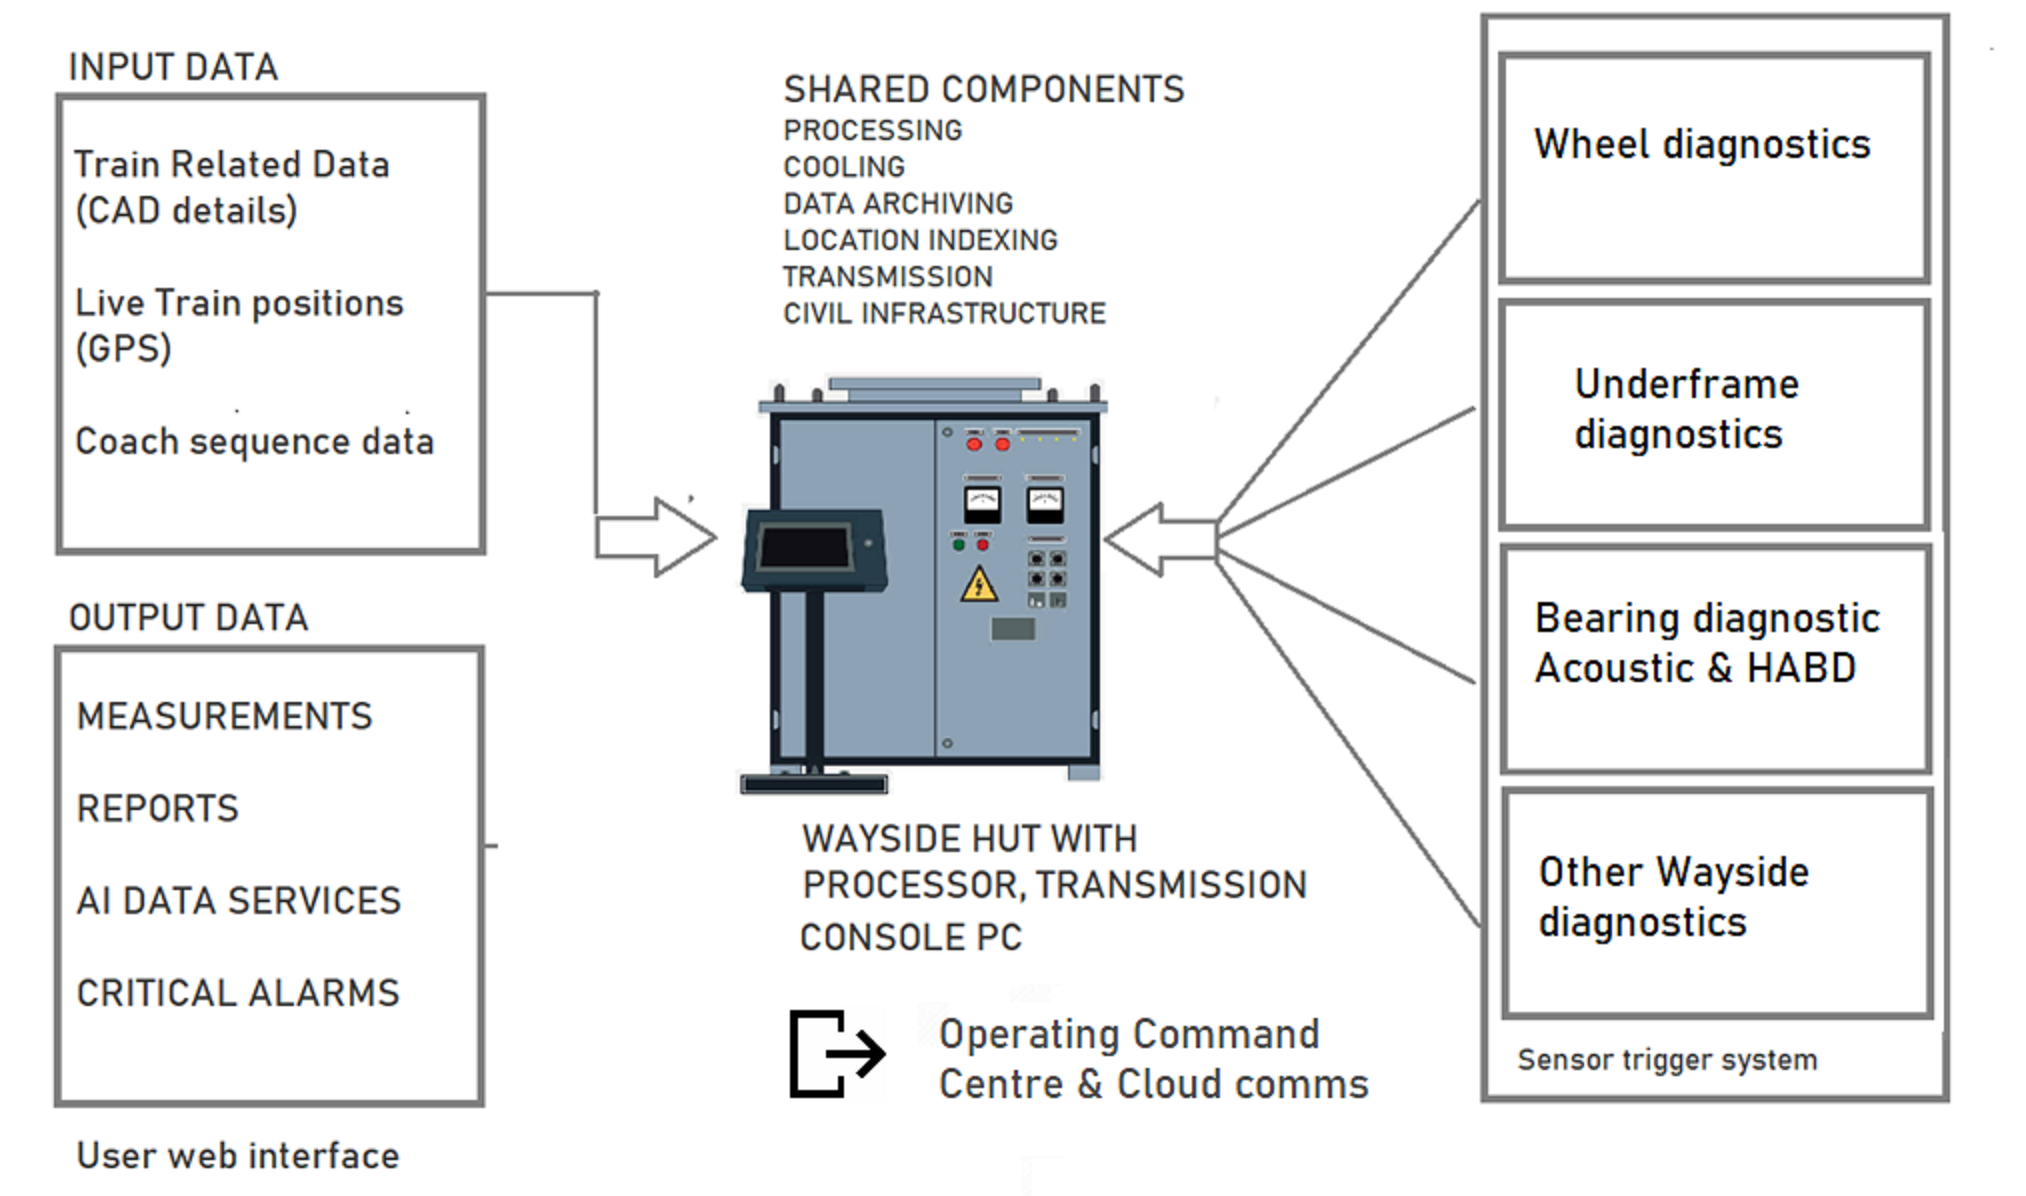
The data management process requires the following components.
- TrackVue Z, S or V Series system mounted on the train that have a PC console in the vehicle for attended operations, or hidden for unattended operations. These systems have their own internal data storage that gets cleaned after a few days as more raw data arrives and therefore raw data must be taken off these equipment regularly to a remote site.
- A data archive facility for storing raw data. This is usually based at customer-end. The data may be backed up on tapes.
- A quality control hub, a physical IT set-up facility offered by Rail Vision where a copy of raw data and analytics is taken through semi-automated algorithms to remove errors
- An offline-data analysis facility that could be placed at Data Archiving or Quality Control facilities to further analyse any data not possible on the train. If train power is available beyond inspection runs for long periods, this process can also be performed on-board the vehicle.
- A Cloud server, remotely set-up, for taking all real-time critical diagnostic data from the train and taking all offline processed data for delivery of results to the customer
The following picture shows how data is managed from the train to the cloud in a series of steps.
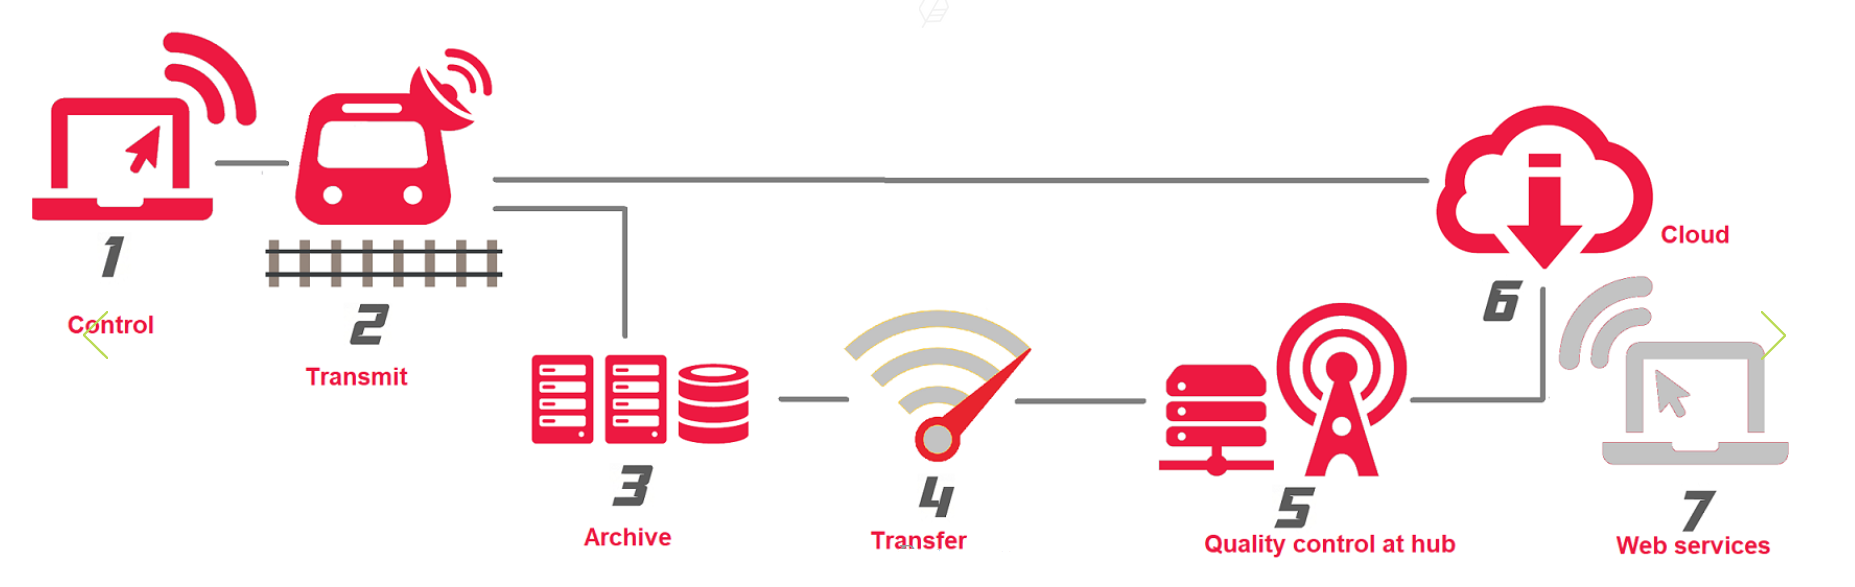
The data is managed as follows:
- In the attended mode, the user connects the laptop and uses TrackVue desktop software to start a new inspection run by entering project details; RV can assist remotely with this during live operations. In unattended mode, remote control is possible under normal revenue operations, but this requires appropriate network connectivity to manage the system (Step 1).
2. The near real-time analysis by on-board processors generates measurements. These are managed as
follows:
Critical Data Management
The following measurements are considered as time critical:
(i) Rail breaks
(ii) Weld fractures
(iii) Wide gauge
(iv) Any other fault considered by the customer as critical
These measurements are transmitted from the train in real-time to a cloud interface such that the customer can see these results immediately (step 2). The alarms may also be sent by email or phone text
messages as needed to the designated user and any command centre.
Non Critical Data Management
All other measurements are considered non-critical. These may be processed in real-time, offline or in
combination. These are not immediately transferred from the train to the cloud interface as these need
further data management and quality control.
3. At the end of the run, the raw and initially processed data is manually copied to an archive server at user
end if one exists; The processed data consists of raw linescan imagery and database of results with
assets and defects indexed by GPS and Point Kilometer location with Division/SubDivision details. (Step
3)
4. A copy of the raw data is sent to Rail Vision team for data management & quality control.(Step 4)
5. Quality control operations use baseline corrections and false positive removals as a combination of
completely automated and some manual checks (Step 5).
6. Once data management is complete, the offline facility uploads results of analysis on an on-line cloud
portal if such a service is needed, or otherwise to the designated IT server at customer end. The
customer receives communication that track measurements are available online. (Step 6)
7. Users are given login-password details to view analysis on the portal. They can view and download
diagnostic reports for maintenance.(Step 7)
TrackVue real-time data acquisition and data analytics software works on the train as follows once a new inspection run is started by the user:
- All sensors are started to be ready for data collection; multiple light sources light the scene
- Once the vehicle starts to move, wheel encoder signals are used to trigger cameras, lasers and inertial sensors to generate uniformly spaced data
- Each image/laser/inertial data sample is tagged with unique GPS and point-kilometer values; external information from Istanbul Metro on known position of landmarks, e.g. stations, switch areas etc. can be used to re- synchronize location data if it drifts. Interpolation is used to cover tunnel areas where GPS may be unavailable. Typical GPS accuracy is around 1-2 meters; overall accuracy depends on available data on landmarks and their accurate detection for time-stamp based matching. TrackVue data acquisition system also offers a manual trigger for changing line location or registering Point Kilometer data during a live run as the train passes a specific location.
- Each sensor sample is passed to automated image analytics software. If too many features need to be processed, load may be split between online and offline analysis. Real-time analysis generates measurements and detections and stores them in a database. Graphical user interface shows analysis results.
- During acquisition, raw data is collected with results on TrackVue equipment using 50Tb SSD, and a copy is transferred to the connected laptop using a high speed connection.
- Once the user stops an inspection run, data continues to be transferred to the laptop unless all data has been transferred. The system cannot be powered off unless this is complete.
RV Data Management for Train Inspection
Trains to Cloud
dssd