
Pantograph Measurements
Background
Video based imaging systems provide excellent information related to the condition of the pantograph and geometry of catenary wires. Carbon current collector strips experience the greatest amount of wear and tear a lot of which is related to track and catenary geometry. Catenary stagger design is aimed to reduce quick burn-outs of the carbon strip in the same position. Issues with such design or defects in pantograph may lead to quick burn outs which then require replacement. Pantograph measurements are directed at understanding the behaviour of pantograph- contact wire interface. AI algorithms code what is considered as normal movement of the pantograph, both laterally and height-wise, and use thresholds to generate exceptions where abnormalities are observed. These exceptions may indicate that either wire stagger is not sufficient or pantograph does not use the full span of the stagger, or that the wire height under load is lower than expected, all leading to strip burnouts. Data analytics can also highlight mechanical issues with the pantograph.
| Pantograph Measurements | |
|---|---|
| Contact position | Wire contact position with respect to centre of pantograph, track position |
| Contact position deviation | Standard deviation in contact position over time between two set locations |
| Pantograph Vertical movement | Height of pantograph contact point with contact wire above the base of pantograph in mm, track location |
| Contact temperature | Temperature in celsius, arcing, track location |
| Wire geometry | Height and stagger under load |
RV Diagnostics
We use V Series high resolution video imaging equipment and real-time data analytics solution to image pantograph at high image resolution and have dedicated LED lighting for night time operations. The imaging is triggered using a wheel encoder at speeds of up to 60 frames per second to ensure that data is uniformly sampled based on train speed.
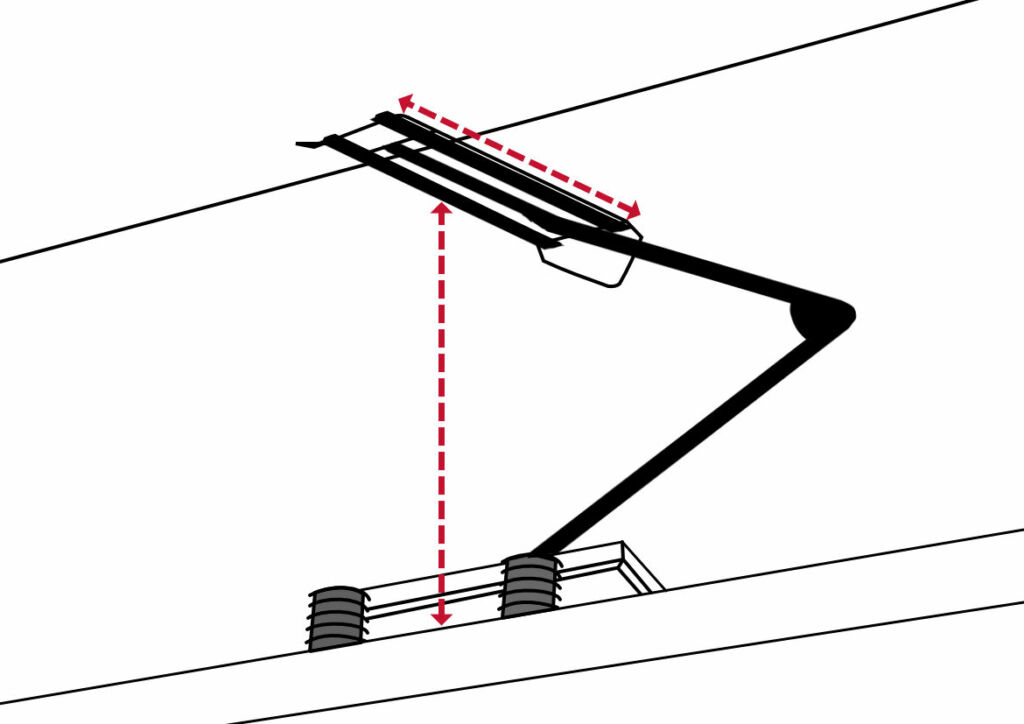
In the diagram to the left, the following measurements are made.
- Contact positioning of pantograph against contact wire, calculated in millimetres as the difference between their central positions M1
- Low pass filtered measurements clustered to show track sections where carbon strips are most at risk from excessive wear because of poor alignment between them and contact wires M2
- Data from M1 and M2 correlated against known vertical inclines and horizontal curves on the track to understand vehicle behaviour in these areas
- Dynamic Pantograph Height under load calculated in millimetres M3
- Loaded wire height and stagger based on the above measurements
RV Advantage
Pantograph measurement equipment which uses video imaging alone and does not use any laser based devices typical of catenary measurements, provides an excellent low cost solution compared to a comprehensive overhead line measurement system. The key benefits of this lightweight system are:
- The system weighs less than 10Kg and is very easy to mount on the top of the train
- Integrated LED lighting solution allows for night time operations
- There is very less in-cabin equipment
- The system performs real-time analytics and only stores the results reducing storage needs and eliminating the need for off-line data analysis set-up