Rail Wheel Interface
Background
As rolling stock owners reprofile their wheels and civil/track teams grind rail and manage/repair rails, there is a constant tussle on whether rolling stock/wheels damage rails or vice-versa. Without objective data, no one knows. As situation gets worse, both rail and wheel may get reprofiled more often than expected, reducing their age by up to 50%, a massive cost to the railways. Poor rail-wheel interaction (where such interaction is specified in terms of positioning of the wheel on the rail defined by contact area and gaps in contact profile) may be caused because of a number of factors including poor track geometry, poor rail grinding, lack of flange lubrication etc. and affects load on the rails as shown by the figure below.
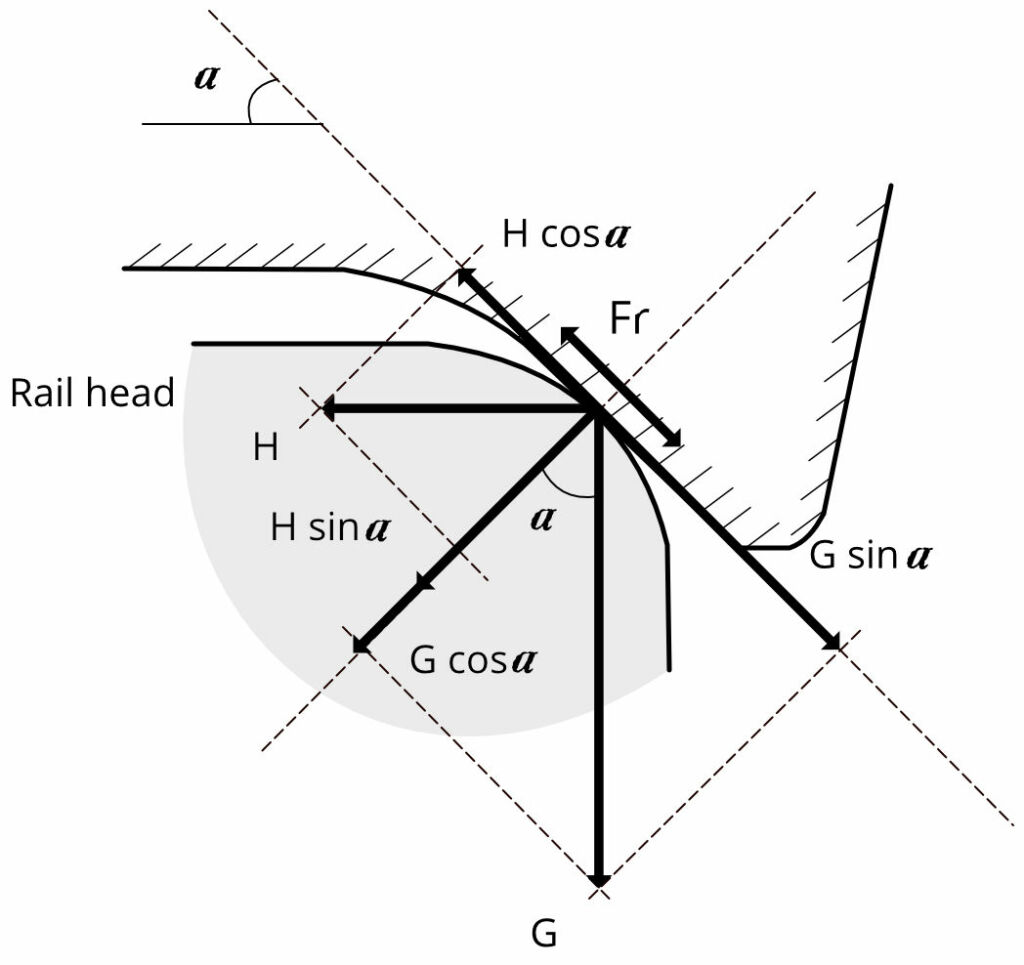
Force G is caused by Axle Load
Force H is associated with acceleration, track imperfections and curvature
RV Diagnostics
Rail Vision TrackVue Z series equipment makes all 6 required measurements stated below. The measurement can be made for any wheel age and known wheel wear, where baseline measurements can be made for new wheels (zero wear). The following measurements are made.
| Rail Wheel Interface Measurements | |
|---|---|
| Hunting movement | Hunting in mm every 20 cms along the track, track position |
| Accelerations | 3D (x,y,z) plate acceleration data, track position |
| Vehicle position | 3D (x,y,z) pan, tilt and yaw, track curvature |
| Rail wheel contact | Potential lateral shift, contact centre position, track position |
| Rail wheel contact | Single or twin point contact, track position |
| Rail wheel contact | Angle of head and flange contact, track position |
| Rail wheel contact | Contact area in millimeter square, track position |
The following slideshow shows a strip-chart of RWI measurement as made by TrackVue Z series equipment- the first chart shows good quality rail-wheel interaction, and the second chart shows highlighted poor quality rail wheel interaction.
RV Advantage
- We are one of the very few companies with technology to make these measurements. Each measurement is made 20 cms apart along the direction of movement.
- With chosen customers, the benefits of this technology have been demonstrated by highlighting track sections that have issues and are more likely to have damaged rail in the future.
- RV can provide excellent data for predictive maintenance and information on root cause of problems behind developing rail or wheel issues.
.