Vegetation Track Infringement
Background
Vegetation in the vicinity of rail tracks may consist of grass, shrubs and trees. The size and proximity of these with respect to the track centreline is used to determine the risk to rail track operations. Vegetation that grows closer to the track may represent a threat to track clearance for rolling stock and overhead lines. Tall trees that are not an immediate threat may also need precautionary management to reduce the chances of them becoming a risk later. S series equipment uses a combination of colour imagery combined with LIDAR data to detect the position of vegetation and measure its properties (size, proximity to track centreline, type). A risk assessment algorithm uses this information along with known position of signals, speed signs and level crossings, and track curvature to determine the level of risk posed by vegetation, and whether assets still have the minimum required sighting distances.
RV Diagnostics
Rail Vision S series equipment uses high quality colour camera analytics combined with Lidar measurements to measure vegetation envelope surrounding the track. The following measurements are made.
| Vegetation Measurements | |
|---|---|
| Classification | Type (Shrub, Tree) |
| Dimension | Coverage, height |
| Clearance | Distance to kinetic envelope in mm, Distance to Track Centre Line |
| Density | Density per meter along the direction of travel |
| Risk | Yes/No |
| Risk type | Track risk, overhead line risk, sighting risk |
Any vegetation object appearing within the clearance envelope of the track is highlighted as an alarm and stored with track position (GPS and line reference). The following images show how the data is acquired, analysed, exceptions determined and a digital vegetation map created to show the type of vegetation, its condition and risk areas along the track.
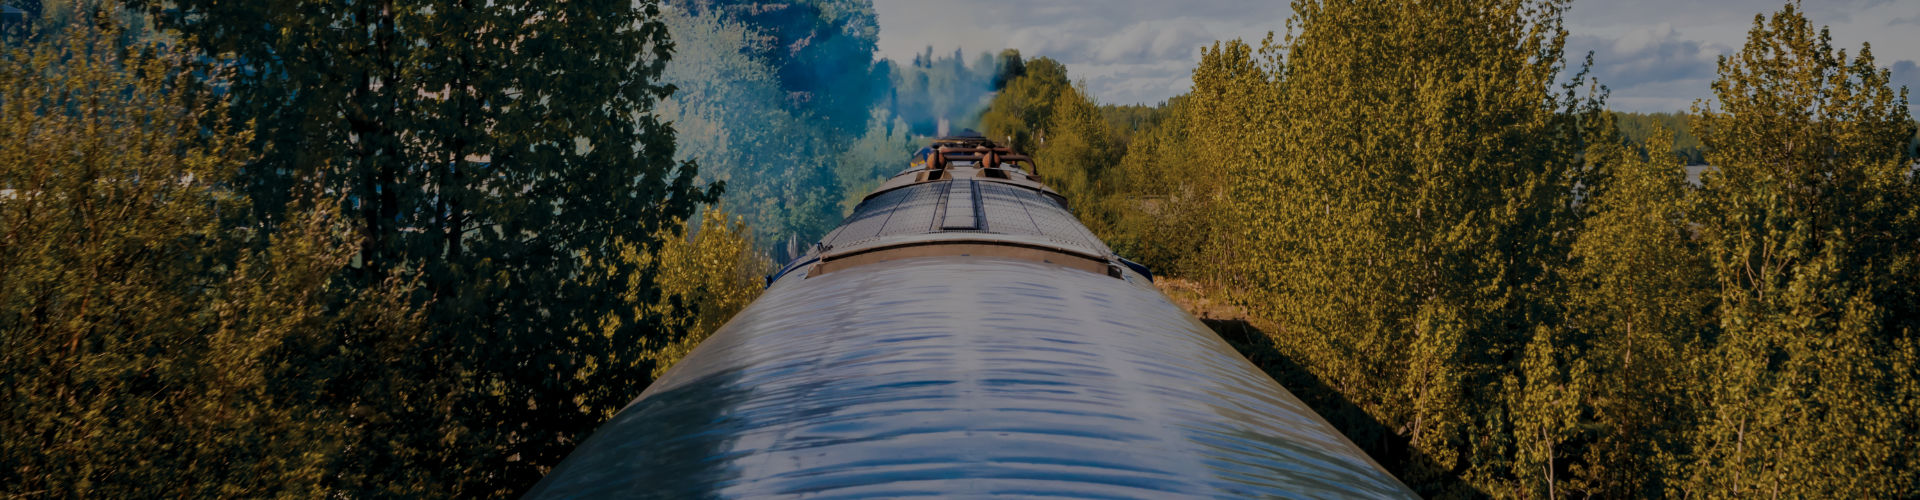
It is common for railway tracks to have vegetation in their vicinity. Over time, vegetation can grow significantly and tree branches can easily infringe rolling stock movement. In such cases, the vegetation proximity to track centreline is reduced and it starts to have major impact on driver visibility and therefore timely braking. The situation is worse particularly around curved track, where speed signs, signals and other important markers may not be visible in good time compromising safety. Vegetation must be therefore classified (e.g. shrubs, trees) and further sub-classified on the basis of their size and appearance. Hazardous trees must be separately detected to ensure that these are regularly monitored in repeat inspections.
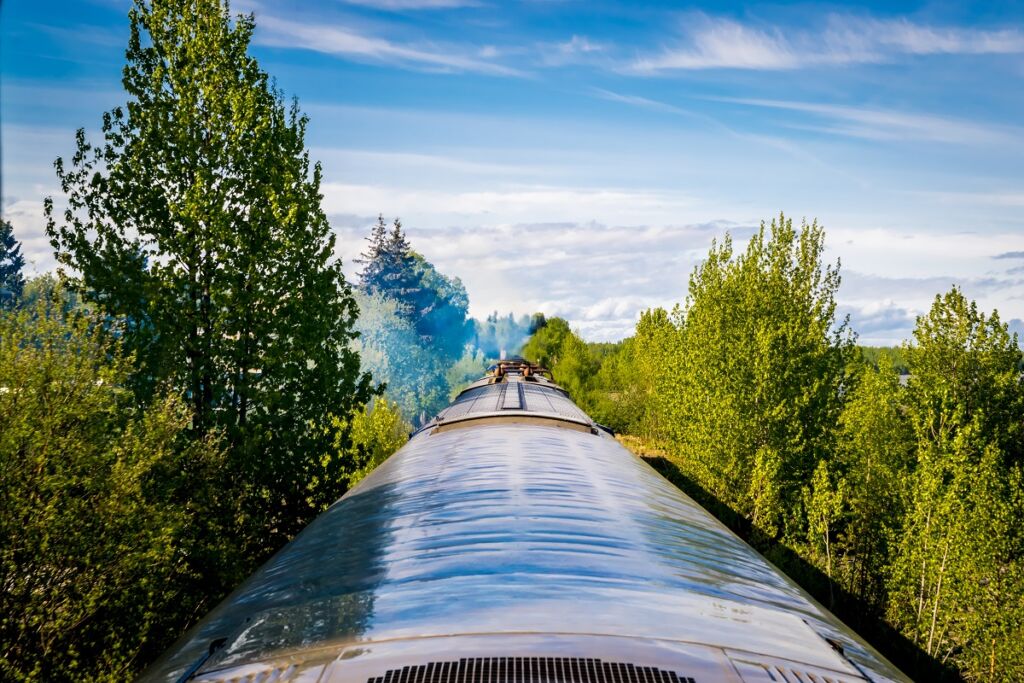
S series equipment uses a combination of colour imagery combined with LIDAR data to detect the position of vegetation and measure its properties (size, proximity to track centreline, type). A risk assessment algorithm uses this information along with known position of signals, speed signs and level crossings, and track curvature to determine the level of risk posed by vegetation, and whether assets still have the minimum required sighting distances. The data may be sampled every 2 meters along the direction of travel. The process of data collection and analysis is fully automated.
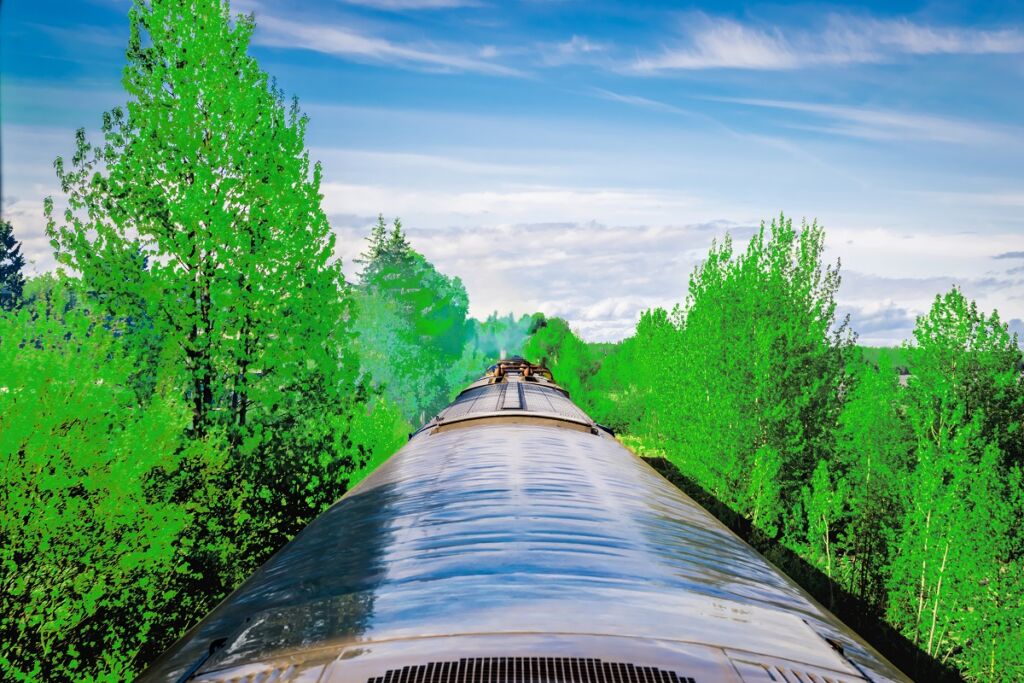
Determining the distance between vegetation and track centreline is very important. The image to the left shows those vegetation areas that infringe a threshold line set by the user and encroach on track area. These will cause issues for driver visibility and for overhead lines. Lidar based imaging creates a detailed 3D profile of point cloud data which can provide depth information but must be overlaid on colour image data to map data points to object identity.
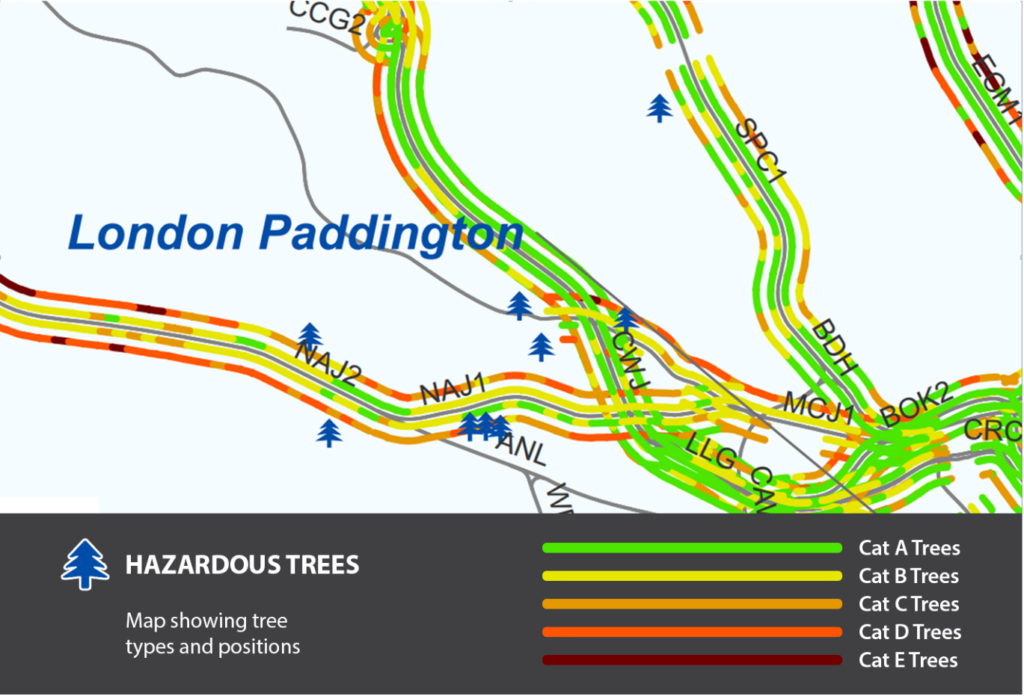
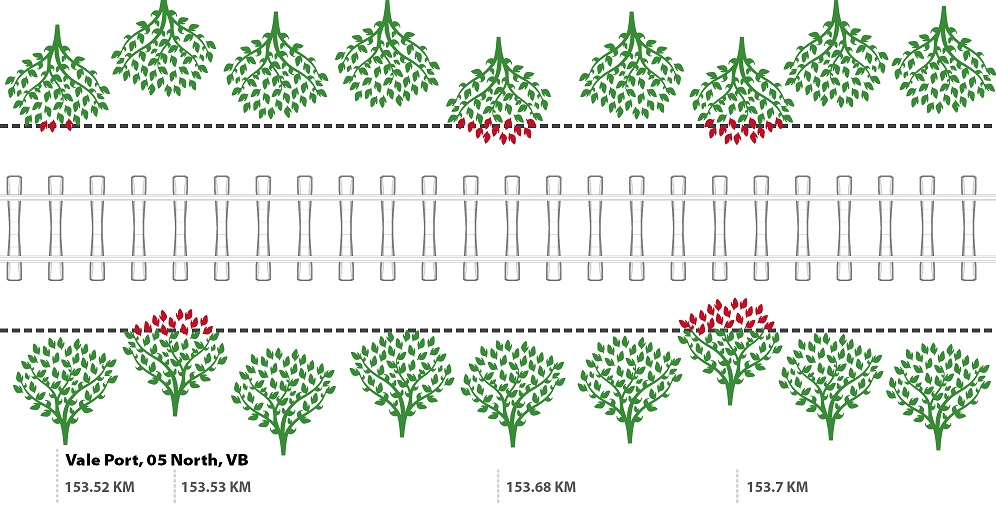
The automated analysis of vegetation (type, size, risk level) allows TrackVue software to generate vegetation maps for the network. Figure on the left shows an example map where different tracks are labelled for the type of vegetation growing around them with specific risk items identified. Vegetation maps are ideal for providing a broad overview of risk posed by vegetation across the network. Map comparisons over time show where track positions are affected by significant changes (e.g. a comparison before and after the cutting of lineside vegetation audits the quality of work, and a comparison between spring and autumn periods show the rate of growth). The maps may be coloured to reflect the level of risk posed by vegetation along the direction of movement. On the left we show different category vegetation plotted along with specific spots with hazardous trees that need to be managed.
RV Advantage
There are several advantages of RV approaches to vegetation management and infringement detection. These include:
- We use a combination of Lidar and optical imaging sensors to have a full view of track clearances
- Our systems can collect data in one pass on the tracks combined with other measurements
- Digital maps integrate vegetation clearance data with other analysis
- The technology is easily extended to weed detection on tracks and sensor controlled spraying of herbicides